
Soils and the Comprehensive Plan: What Your Soil Survey Is Trying to Tell You
Part 1 of 4 in our July series on Natural Resources and the Comprehensive Plan.
Soils: The Ground Under Your Plan
Most comprehensive plans nod politely at soils and then move on. A paragraph in the natural resources chapter, a phrase mentioning “environment” in the goals, a reference to the Natural Resources Conservation Service (NRCS) soil survey in the appendix, maybe a map showing general soil associations—and then the plan gets back to the “real” work of land use, transportation, and housing. The soils chapter does what it has always done: sit there, quietly accurate and largely ignored.
You can see the pattern in plans I’ve helped write and in plans I’ve read for fun on a Sunday afternoon. We inventory soils because the checklist says we should, not because we expect commissioners or village trustees to use that information when they look at a subdivision plat or a future land use map. The result is a strange split‐screen: one set of documents, written by soil scientists, describing exactly how water, foundations, and septic systems will behave on the ground; another set of documents, written by planners, deciding where growth belongs without ever bringing those soil maps into the room.
This article is about closing that gap. Your county’s soil survey is not just background material. It is, quite literally, the ground under every zoning decision, every road project, every “starter home” subdivision the board approves on what looks like cheap land. It is the closest thing you have to an expert opinion on where development belongs—and where it will quietly fight you for the next fifty years.

I – Soil As Infrastructure
Reframing Soil in the Plan
Here’s the idea we used to remember and forgot as we got further from the land: soil is infrastructure in the same way that roads and pipes are infrastructure. It determines how stormwater moves across and through the landscape, whether septic systems function, how expensive foundations become, how long local roads remain stable, and how much drainage infrastructure a new subdivision will ultimately require. We budget carefully for roads and pipes. We rarely budget for the consequences of ignoring soils.
In most small towns and rural counties, the largest line items in the capital plan are highways, water systems, and utilities, with line after line dedicated to overlays, culvert replacements, and pump station upgrades. Every one of those investments depends on what’s underneath. A paved road built on a weak subgrade will require more frequent resurfacing and patching. Expansive clays—shrink–swell soils—can move enough between wet and dry seasons to crack pavements, heave curbs, and pull joints apart, driving up maintenance costs year after year. A water line laid in unstable, collapsible soils will experience differential settlement and break more often, not because the pipe was bad, but because the soil was doing what the soil has always done.
The same pattern plays out at the subdivision scale. A new rural subdivision platted on poorly drained soils will see sump pumps cycling constantly in wet years, foundation drains running day and night, and front yards turned into informal detention basins after heavy rain. Ditches and backyard swales that looked adequate on the grading plan become standing‑water features because the underlying soil can’t absorb what the design assumed it would. That’s not an isolated “drainage problem”; it’s a land‑use decision made without regard for soil capacity. Soil isn’t just a natural resource; it’s part of the built environment whether we acknowledge it or not.
When Ignoring Soils Shows Up in the Budget
The difference between treating soil as infrastructure and treating it as scenery shows up a decade later on the maintenance schedule. A road built on shrink–swell clays will crack, heave, and open joints as the soil expands and contracts with moisture, sometimes enough to lift or drop sections of pavement by several inches. Chip‑seal laid over a marginal base may look fine at construction and then ravel, rut, and washboard long before its expected service life, forcing counties into more frequent blading, patching, or full‑depth repairs.
Similar stories unfold with onsite wastewater. A septic system installed on soils rated Very Limited for absorption may pass inspection, serve a family for a few years, and then begin to fail—gradually at first, then suddenly—as effluent hits an impermeable layer and follows the path of least resistance to the surface or to a nearby ditch. Toilets still flush, but the drainfield is quietly overloading, sending nutrients and bacteria into groundwater and surface water. The U.S. EPA has identified malfunctioning septic systems as a significant source of surface‑water pollution; soils that cannot absorb what the system produces are one of the underlying causes.
In the moment, each of these cases looks like an engineering challenge: add rebar to the pavement, over‑excavate the roadbed and bring in structural fill, install underdrains, upgrade from a conventional septic tank to an advanced treatment system, add more sump pumps, dig a larger dry well in the backyard. But in practice, those decisions show up as line items—on county budgets, road department work plans, emergency board actions, special assessments, and, eventually, tax bills. Maintenance crews respond to washouts that weren’t accidents; they were predictable outcomes of building on unstable soils. Health departments chase failing septic systems in areas mapped as Very Limited. Homeowners pay to retrofit drainage on lots that never should have relied on infiltration alone.
The costs are real. They just tend to arrive later, after the approvals have been granted and the political will to revisit them has evaporated. In a small town, that often means a familiar story: “We inherited these roads,” or “That subdivision was platted before our current regulations.” The soil survey, however, has been quietly telling the same story for decades—that some landscapes will carry infrastructure easily and others will fight it every step of the way.
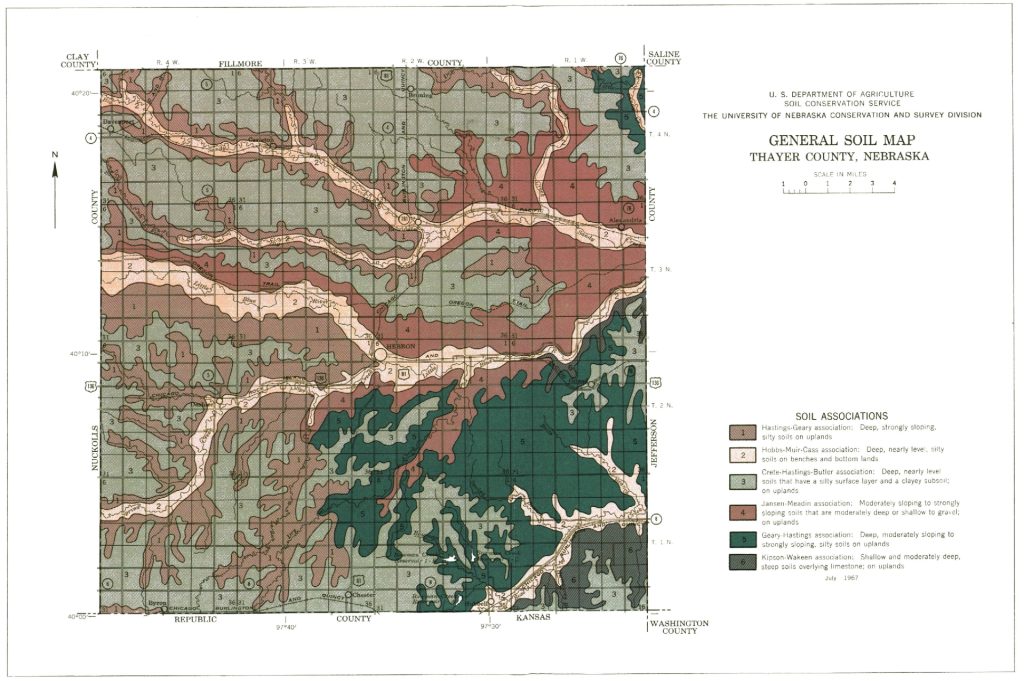
In Thayer County, Nebraska’s comprehensive plan, for example, the natural resources chapter takes this infrastructure lens seriously: soil limitations are presented side‑by‑side with roads, basements, septic systems, lagoons, landfills, and small commercial buildings, with NRCS ratings spelled out in tables that show how flooding, shrink–swell, ponding, depth to the saturated zone, slope, and slow water movement drive long‑term performance. Most soil types in the county are rated Very Limited for dwellings and septic systems, not because development is impossible, but because conventional construction in the wrong locations will predictably need special designs, reclamation, or intensive maintenance. The work we did at Marvin Planning Consultants contains more detail on soils than I have ever put in a comprehensive plan before, in part because soils are such a determining factor in future development decisions.
In more recent plans, I moved much of the technical soils details into the appendices for reference. Clay County’s Appendices go a step further than neighboring Thayer County, for example. We tried to explain in plain language that “soil limitations do not generally prohibit certain uses of land; however, they indicate the need for site‑specific study and often special engineering solutions,” and then walk through how flooding, depth to saturated zone or bedrock, shrink–swell, ponding, and slow water movement translate directly into costs for dwellings, septic systems, lagoons, and landfills. We wanted a practical guide right at hand for Planning Commissioners and County Board members to look at when they had a project to review.
Engineering vs. Planning: Different Questions
This is where the distinction between engineering and planning matters. Engineering asks whether a project is possible: can we design a foundation that won’t fail, a septic system that will function, a roadway that will carry the load on poor soils. The answer is often yes—with enough money, enough concrete, enough pipe, and sometimes with specialized soil‑stabilization techniques. Planning is supposed to ask whether the development is appropriate in that location in the first place.
When a county approves twenty subdivisions on soils rated Somewhat Limited or Very Limited for septic systems and local roads, it isn’t just solving twenty engineering problems. It is quietly rewriting its infrastructure obligations for the next fifty years. Every driveway, cul‑de‑sac, drainfield, and sump pump in those subdivisions becomes a small piece of a larger system—a system the public will help maintain, upgrade, and, when necessary, repair. That is the level where comprehensive planning lives.
The question isn’t whether we can overcome difficult soils today. It’s whether we should encourage development in locations that require expensive engineering solutions, knowing exactly who will pay for those solutions down the line. Engineering asks, “Can this site be made to work?” Planning asks, “Given what we know about these soils, is this where growth belongs?” In counties that take soils seriously as infrastructure, that second question shapes future land use maps, subdivision regulations, and capital improvement plans. In counties that don’t, the second question is answered quietly—later, in rising maintenance costs and emergency repairs.
A Village-Scale Soils Scenario
Let’s visualize one way this plays out at village scale:
A few years ago, a village on the edge of farm country approved a three‑street subdivision on flat ground just beyond its last row of houses. The plat looked harmless enough: quarter‑acre lots, modest single‑family homes, a short loop street with two cul‑de‑sacs. The soils map showed “poorly drained” terrace soils in the area, but the village had no process for using that information. The zoning was in place, the developer promised “starter homes for local families,” and the council said yes.
The first spring after construction, residents started to notice things. Sump pumps in basements ran steadily for days after every rain, some cycling every few minutes when the water table came up. Backyards stayed wet long after the streets dried. The shallow roadside ditches, designed to carry water away, filled and held it instead. On the worst days, a sheet of water crept across driveways and sidewalks because the underlying soil couldn’t absorb what the drainage plan assumed it would. The subdivision’s storm sewer did its best, but infiltration never showed up to do its share.
Within a decade, the village’s public works director could point to that three‑street subdivision on the capital plan. It needed more frequent street patching where the pavement base had weakened. It needed ditch grading and additional culverts to manage standing water. Several homes had replaced or upgraded sump pumps, and at least one had installed a backyard dry well to keep discharge from running across the neighbor’s lot. None of these problems rose to the level of disaster. All of them rose to the level of cost—incremental, persistent, and avoidable.
When staff eventually went back to the Web Soil Survey, the story was simple. The entire subdivision sat on soils rated Very Limited for dwellings with basements and septic tank absorption fields, with documented drainage and seasonal high water table issues. Engineering had made the site work—foundations were reinforced, perimeter drains and sump pumps installed, streets built with a bit more base. Planning had never asked whether this was where the village wanted to steer growth, given what the soils were already saying.
That’s the scale where soil as infrastructure stops being an abstract idea and starts being a line on the village’s maintenance spreadsheet.

II – Reading Soil Surveys for Planning Decisions
What NRCS Already Knows About Your Land
Your city or county doesn’t have to start from scratch. Much of what planners need to know about the ground under their future land use map has already been collected, interpreted, and made publicly available by the USDA Soil Conservation Service, since 1994 known as the USDA Natural Resources Conservation Service (NRCS), which has been mapping soils across the United States for over a century. Through the Web Soil Survey, NRCS now delivers soil maps and data online for more than 95 percent of the nation’s counties, with the remainder still in progress.
The old Soil Conservation Service (SCS) grew out of the 1930s Soil Erosion Service in the Department of the Interior. The SCS was in charge of Civilian Conservation Corps camps between 1933 and 1942, a Depression-era work program to counter effects of the Dust Bowl. The National Cooperative Soil Survey (NCSS) is a partnership led by NRCS of Federal land management agencies, state agricultural experiment stations, counties, conservation districts, and other special-purpose districts providing soil survey information since 1896. As well, NRCS administers technical and financial assistance programs for private land owners, conservation districts, tribes, and other organizations.
Printed soil survey reports were the main source of soils information from 1899 to 2005. Most of these reports are county-based and have been converted to PDFs. USDA phased out the printing of reports after making Web Soil Survey the official source for soils information in 2005. Not every county in the US is mapped, but most rural counties have a soil survey or two. (The historical documents can be a fascinating read, trust me on that.) Since 2022, digital files of historic county-level soil surveys have been posted to the Internet Archive digital library.
Every mapped soil series comes with a description of its physical characteristics: texture (sand, silt, clay), permeability, drainage class, depth to bedrock or restrictive layers, and typical landscape position—upland, terrace, bottomland, slope, or depression. These are the ingredients that determine how water, roots, and structures behave. NRCS then provides interpretations—ratings for specific uses—built on top of those characteristics. This is where the planner’s work begins. You don’t have to interpret bulk density, cation exchange capacity (CEC), or available water holding capacity. You can read the columns labeled “Dwellings,” “Local Roads and Streets,” and “Septic Tank Absorption Fields” and ask a very practical question: What does this mean for our future land use map, our subdivision regulations, and our capital plan?
Web Soil Survey is designed to make that leap possible. It lets you draw an Area of Interest (AOI) around a town, a growth corridor, or a single proposed subdivision; generate a soil map for that AOI; and then pull reports that list each soil type, its properties, and its ratings. In a few minutes, planning staff can move from “this area is zoned for growth” to “this area is dominated by soils that are Somewhat Limited or Very Limited for septic systems and local roads.” The data are not perfect—they still benefit from site‑specific investigations—but they are good enough to raise flags, ask harder questions, and steer policy.
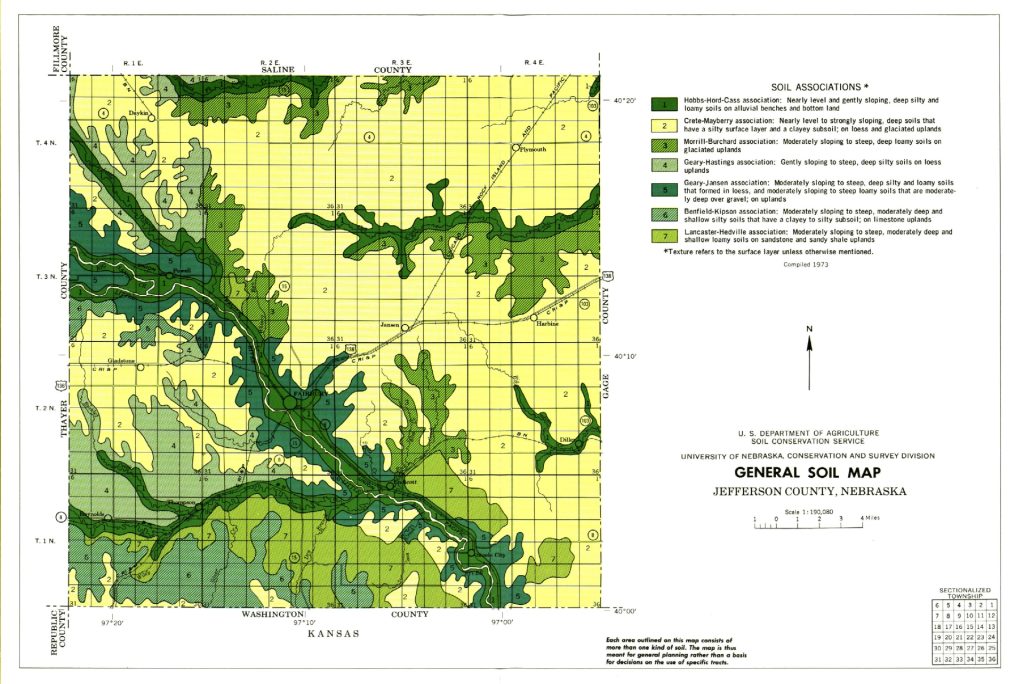
In Jefferson County, Nebraska’s comprehensive plan, we introduced soil associations this way. The natural resources chapter explains that each map unit on the general soil map is “a unique natural landscape,” typically made up of one or more major soils and minor soils, and then lists series named Benfield, Butler, Cass, Crete, Geary, Hastings, Hobbs, Jansen, Kipson, Lancaster, Malmo, Morrill, Nodaway, Uly, and Wymore. Many of those soils series appear in surveys across the state, yet each county has different local conditions. We summarized in a plan appendix suitability and limitations for dwellings, septic fields, lagoons, landfills, and small commercial businesses—the standard tables which any professional planner should be familiar with from site planning class (I think I slept in that day, though). In Thayer County, next door, similar tables show how associations dominated by Crete, Hastings, Butler, Hall, and Hord soils cover large shares of the landscape, with acreage and percentage by soil unit, giving planners a quantitative sense of where prime upland cropland overlaps with growth areas and where flood‑prone terrace and bottomland soils quietly underlie road and septic decisions.
We had quite the discussion during public hearings in Jefferson County on how well the old Soil Conservation Service (now NRC) compiled the original maps, but they happen to be the best we have at scale. Any site plan ought to use Web Soil Survey as a starting point, not an ending point.
For counties that are just starting to use soil information in planning, it can help to think of the soil survey as a second future land use map, drawn by scientists instead of elected officials. One map shows what the community has decided the land should be used for. The other map shows what the land is physically prepared to support. The work of comprehensive planning is bringing those two maps into conversation.

How Soil Ratings Work (And Why They’re Not Suggestions)
For each soil type, NRCS evaluates suitability for common land uses we care about:
- Dwellings with basements
- Dwellings without basements
- Septic tank absorption fields and sewage lagoons
- Local roads and streets
- Small commercial buildings
- Sanitary landfills
Each of these uses receives a rating: Not Limited, Somewhat Limited, or Very Limited. Behind those three words sit very specific constraints—high water table, flooding risk, slow permeability, shallow depth to bedrock, excessive slope, or high shrink–swell potential. Not Limited means a use is generally suitable with conventional methods. Somewhat Limited means limitations exist but can be overcome with design adjustments or additional cost. Very Limited means significant limitations that are hard or expensive to overcome.

Soil Limitations
Thayer County’s soil limitations tables for example, drawn from Web Soil Survey, show this played out in numbers. For each soil symbol—Roxbury, Uly, Hobbs, Crete, Butler, Geary, Hastings, Scott, Fillmore—the plan lists suitability for dwellings, septic fields, lagoons, landfills, and small commercial businesses, with most soils falling into the Somewhat Limited or Very Limited categories for at least one of those uses. The legend reads almost like a translation guide for planners: green for Not Limited, yellow for Somewhat Limited, red for Very Limited, and numbered notes for the specific constraints—flooding, shrink–swell, ponding, depth to saturated zone or bedrock, slope, slow water movement, seepage, filtering capacity, “too clayey,” or “too sandy.”
These ratings are not advisory opinions. They describe the physical reality of what a soil will and will not do. A Very Limited rating for septic tank absorption fields is not NRCS saying, “You probably shouldn’t.” It is NRCS saying, “This soil has properties that make conventional septic systems prone to failure unless you change the design or the assumption.” The land may be zoned for large‑lot residential. The soil may be telling you that conventional onsite wastewater treatment is a bad idea. And the soil survey is telling you to have site specific surveys done before making decisions you can’t take back.
Consider two proposed subdivisions of equal size. One sits on well‑drained upland soils rated Not Limited for dwellings, septic systems, and local roads. Streets can be built with standard sections. Foundations can be conventional. Septic systems can function with relatively simple designs. The other subdivision lies on poorly drained terrace soils with a high water table, rated Somewhat Limited or Very Limited for the same uses. Roads will need additional base and drainage. Foundations may require special design—perhaps deeper footings or a different foundation type. Septic systems will need advanced treatment or may not be appropriate at all, pushing the conversation toward clustered systems or eventual extension of public sewer.
Both subdivisions can “work” with enough engineering. But only one reflects sound long‑term public policy. From a planner’s perspective, the distinction is simple: one location aligns growth with soils that are ready to carry it; the other location commits the community to higher costs and higher risks long after the subdivision is built out. The soil survey tells you which one before a single application is filed. That is the difference between using soils as background context and using them as a decision‑making tool.

From Individual Limits to Cumulative Costs
It’s tempting to treat each Very Limited rating as a site‑specific engineering problem and move on. A developer proposes deeper foundations; the county engineer reviews the section and signs off. A designer proposes an advanced wastewater system; the health department approves it with conditions. On paper, each project meets standards. On the ground, the pattern builds.
A single subdivision built on marginal soils may not seem significant. Twenty similar approvals over two decades can permanently alter drainage patterns, push more runoff onto neighboring properties, increase road maintenance costs, fragment prime farmland, and lock counties into infrastructure obligations that were entirely predictable—and largely avoidable. Soils that are Very Limited for septic systems can become chronic sources of nutrient loading to streams. Soils that are Very Limited for local roads can drive a cycle of repeated patching and resurfacing that never quite catches up. Soils that are Not Limited for agriculture but heavily developed for housing can quietly erase the county’s most productive land base.
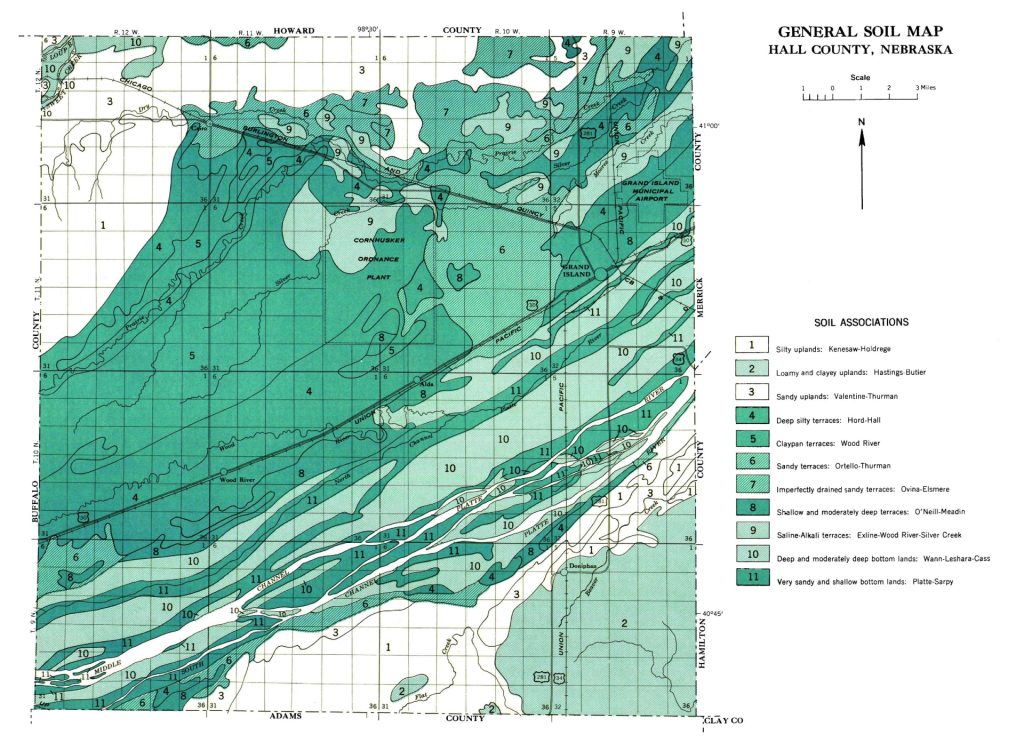
In Jefferson County, more than 90 percent of mapped soil types are rated Very Limited for septic tank and absorption fields, and “many soil types” are Very Limited for sewage lagoons and sanitary landfills, a pattern the plan explicitly ties to long‑term public costs: repeated engineering fixes, stricter floodplain requirements, and the gradual shift of nutrient and drainage problems onto downstream neighbors. The Hall County, Nebraska, Comprehensive Plan appendix tells a similar story: roughly 82 percent of soil types are Very Limited for septic systems and about two‑thirds are Very Limited for landfills, with detailed tables showing how flooding, depth to saturated zone, slope, seepage, slow water movement, filtering capacity, and dust all combine to make “conventional” solutions risky over time.
Here is a question comprehensive planning exists to answer: not whether engineering can overcome difficult soils, but whether development should be encouraged in locations that require expensive engineering solutions in the first place. When planning commissions and governing boards see soil ratings presented alongside zoning and infrastructure maps—Not Limited, Somewhat Limited, Very Limited—they have an opportunity to say, “Yes, we can build here, but should we? And if we do, are we prepared to own the consequences?” That is the moment when soil surveys stop being an appendix and start being part of the policy conversation.
A Word of Caution
There are some common pitfalls in interpreting NRCS soils ratings for policy decisions. I don’t pretend I’m a soil scientist—I should have taken geology instead of physics in college, but there’s always time to learn new things. Especially practical things like these:
1. Treating map‑scale data as site‑specific certainty
- Assuming parcel‑level precision. Soil maps are created at a particular scale and are meant to describe patterns across acres, not inches. When you zoom in too far or use one map unit to represent an entire subdivision without ground‑truthing, you overstate the accuracy of the data.
- Ignoring the “not valid at this scale” warning. Web Soil Survey explicitly warns users when they zoom beyond the intended mapping scale, but it’s easy to click past that and keep interpreting colors as precise boundaries.
- Skipping onsite investigation. NRCS is clear: soil survey data seldom contain detailed, site‑specific information and are not intended as primary regulatory tools for site‑specific permitting decisions. They are starting points for planning where fieldwork is not yet feasible, not substitutes for test pits and professional evaluation.
2. Using ratings as simple “yes/no” zoning tools
- Treating “Not Limited” as “no problem.” A Not Limited rating means conventional practices are generally suitable, not that every site in that map unit is free of constraints. Local variation, small depressions, and man‑made changes can still create issues.
- Treating “Very Limited” as a blanket prohibition—or ignoring it entirely. Some communities read Very Limited as “never allow development,” while others simply assume engineering will fix everything. NRCS intends these ratings to highlight limitations and needed management, not to dictate zoning outcomes on their own.
- Forgetting that ratings are use‑specific. A soil might be Very Limited for septic systems but Not Limited for local roads, or vice versa. Collapsing all ratings into a single “good” or “bad” category hides the nuance that should guide policy and design.
3. Ignoring the reasons behind the ratings
- Focusing on the label, not the cause. Each rating comes with reasons—depth to water table, flooding frequency, slow permeability, shrink–swell potential, slope. When planners only look at “Somewhat Limited” or “Very Limited” without reading the reasons, they miss which problems policy or engineering actually needs to solve.
- Mixing up dynamic and static properties. Some limitations reflect relatively stable conditions (like depth to bedrock). Others reflect more dynamic properties that can change with land management, drainage, or compaction. Confusing the two can lead to over‑ or under‑confidence in long‑term performance.
- Assuming one mitigation fixes everything. Designing around a high water table doesn’t fix erosion on steep slopes; stabilizing shrink–swell clay for roads doesn’t make it ideal for septic systems. Each rating reason points to a different kind of constraint.
4. Overlooking the intended planning scale and purpose
- Applying ratings to individual permits instead of patterns. NRCS emphasizes that soil surveys are most useful for broad regulatory planning and as tools for planning onsite investigation, not as the sole basis for individual permit approvals.
- Forgetting that NRCS doesn’t own local decisions. NRCS provides science‑based information but does not accept responsibility for interpretations beyond those delivered in Web Soil Survey, or for regulatory decisions made by counties and states. Treating NRCS ratings as if they “require” a particular zoning outcome is a misunderstanding of roles.
- Ignoring map units with mixed soils. Many map units contain a dominant soil series and several minor ones. Policy built on the assumption that every acre in a unit behaves like the dominant series can miss pockets of very different conditions.
5. Failing to connect ratings to actual policy tools
- Letting ratings sit in the appendix. A common pitfall is including soil maps and tables in the natural resources chapter, then never mentioning them in land use, subdivision, or infrastructure sections where they would shape decisions.
- Not defining how “Somewhat” and “Very Limited” trigger different processes. Without clear thresholds—extra review, required investigations, or design standards—ratings remain descriptive instead of becoming actionable.
- Ignoring cumulative effects. Treating each Very Limited site as an isolated engineering challenge obscures the big picture: repeated approvals on constrained soils can reshape drainage, raise maintenance costs, and affect water quality across the county. Soil survey interpretations are explicitly designed to help with “local planning” at that broader scale.
Most missteps with NRCS soil ratings come from treating mapped limitations as either precise mandates or ignorable background, so use them as a starting point for patterns, pair them with site investigation, and write policies that clearly describe constraints without overstating what the maps can decide on their own.

III – Soils, Prime Farmland, and Resilience in the Comprehensive Plan
Seeing Soil Associations Beneath the Map
Soil surveys organize individual soil types into associations—groups of soils that tend to occur together across the landscape. In Nebraska’s agricultural counties, for example, we work with associations like Hastings–Crete–Butler, Hord–Hall, and related groupings built from series such as Crete, Hastings, Butler, Hall, and Hord. Each association has its own profile of productivity, drainage, and development suitability; one may indicate deep, well‑drained loess uplands, another somewhat poorly drained depressions, another older terraces with high water tables.
Understanding these associations helps planners see the landscape in layers instead of only through zoning colors. On a standard future land use map, everything inside the growth boundary might share the same pastel shade—“Rural Residential,” “Agricultural/Residential,” or “Small Town Fringe.” Underneath, the soil survey is quietly telling a more intricate story:
- Upland soils are often better drained and more suitable for development, but they include some of the most productive cropland—prime farmland by federal criteria. Building here trades long‑term agricultural capacity for short‑term growth.
- Bottomland and river terrace soils are highly productive but prone to flooding, high water tables, and poor drainage. They support agriculture, habitat, and natural storage of floodwater, but can be problematic for basements, septic systems, and roads that expect stable, dry subgrades.
- Transitional and slope soils vary widely but frequently carry erosion‑risk ratings that matter for both crop production and development. What looks like a buildable hilltop on a zoning map may be rated Very Limited for most uses due to slope, shallow restrictive layers, or erodibility.
In Clay County, the soil survey appendix describes a landscape almost tailor‑made for this layered view. Butler and Fillmore series—very deep, somewhat poorly drained loess soils in swales and closed depressions—share the map with Crete, Hastings, Holder, Hall, and Hord series—very deep, well‑drained upland and terrace soils that are intensively cultivated for corn, soybeans, sorghum, wheat, and alfalfa. Scott and Massie series mark very poorly drained closed depressions used mostly for pasture and wildlife habitat. Meadin and Uly series flag steep, excessively drained uplands where erosion and limited cultivation are real concerns.
In Hall County, just northwest of Clay County and bisected by the Platte River, soil appendix adds another layer, with Libory, Valentine, Tryon, Simeon, Platte, Loup, and Wann series showing how sandy dunes, interdunal depressions, and river terraces combine to create areas of rapid infiltration, chronic ponding, and frequent flooding—conditions that matter as much for subdivision layout and septic performance as they do for irrigation and habitat. Taken together, those associations sketch a picture of where the county grows crops best, where water naturally sits, and where roads and basements will fight the landscape more than they should.
Seen through soil associations, the future land use map stops being a flat picture and becomes a layered diagram: where the land wants to grow crops, where it wants to move water, where it quietly resists roads and foundations. That perspective lets counties ask, “If we plan housing here, what are we trading away—and what will it cost?”
Modern GIS platforms make this analysis far more accessible than when soil surveys were bound books on a shelf. Counties can overlay soil limitations and prime farmland layers with future land use categories, zoning districts, floodplains, infrastructure networks, and parcel data to identify conflicts before applications are submitted—before approvals are granted, not after problems emerge. A growth corridor shaded for residential may cross an association dominated by prime soils; that’s a signal to consider conservation design, clustering, or alternative locations. A large‑lot residential district may sit mostly on soils rated Very Limited for septic systems; that’s an invitation to rethink density, utilities, or both.

Prime Farmland: A One‑Way Land Use
The USDA defines prime farmland as land with the best combination of physical and chemical characteristics for producing food, feed, forage, fiber, and oilseed crops. Prime soils have the soil quality, growing season, moisture supply, permeability, and low erosion potential needed to produce sustained high yields economically when managed with acceptable farming methods. They are not excessively erodible or frequently flooded, they are permeable to water and air, and they have few or no stones that interfere with farming.
In Jefferson County’s plan, we included USDA’s language almost verbatim to make the point: prime farmland soils “produce the highest yields with minimal inputs of energy and economic resources, and farming these soils results in the least damage to the environment,” with slopes mainly from 0 to 6 percent, dependable moisture from precipitation or irrigation, acceptable acidity and salt content, few or no rocks, and good permeability to air and water. The chapter then notes, bluntly, that “conversion of prime farmland to urban and industrial uses has been a trend in land use in parts of the county,” and that this loss “tends to put pressure on marginal lands… wet, more erodible, droughty, or difficult to cultivate and less productive than prime farmland.”
On prime farmland, agricultue is generally the highest and best use of land meeting the nation’s short‑ and long‑range needs for food and fiber. Prime soils produce high yields with fewer inputs, lower environmental impact, and greater long‑term resilience than marginal alternatives. In plain language: when you build on prime farmland, you are paving over your county’s best growing ground. You are trading land that can grow food efficiently and reliably for land that will require pavement, pipe, and ongoing maintenance.
Once prime farmland is developed, it is effectively gone. Urban uses rarely revert to agriculture, and the soils beneath pavement and foundations lose structure and fertility over time through compaction, disturbance, and contamination. Even if a building is demolished, deeply compacted or graded soils do not magically return to their former productivity. That makes prime farmland identification one of the most consequential things a comprehensive plan can do—and one of the easiest to defer. It is much simpler to color future land use maps by existing trends than to say, “This area is prime farmland; growth should go somewhere else.”
Practically, this means mapping prime farmland soils explicitly in the natural resources chapter, using NRCS criteria and state guidance, and then cross‑referencing those maps in the land use chapter. It means establishing policies that direct growth toward less productive soils wherever infrastructure and service capacity allow, and that treat prime soils as a limited, strategic resource rather than an inevitable location for the next subdivision. It means connecting soil data to subdivision review so that applications affecting prime farmland trigger additional scrutiny—cluster development that leaves large blocks of prime soils in production, conservation design that shapes roads and lots around the best ground, agricultural buffers along the edges of fields, or outright avoidance where feasible.
Protecting prime agricultural land has also been a focus for planning commissions, city council members, and county commissioners and supervisors. Many jurisdictions limit lot coverage in more urban areas. Some of the counties I worked with applied that protection to maximum coverage of solar generation facilities on prime farmland—if you’re going to cover the land, choose the marginal land and leave prime farmland to farm.
If you’re thinking about how soils fit into a broader agricultural strategy, our earlier piece on sustainable agriculture walks through zoning tools, economic incentives, and conservation programs—like conservation easements and working lands tax policies—that make farmland protection real instead of aspirational. We’ll be revisiting the topic here as well. Prime farmland mapping is the technical foundation; sustainable agriculture policy is how you act on it.
Soil Health and Climate Resilience
As counties begin updating their comprehensive plans for greater resilience to flooding, drought, and shifting weather patterns, soils deserve renewed attention here too. Healthy, well‑structured soils absorb rainfall, reduce runoff, recharge groundwater, and moderate flood peaks. They act like a sponge and a filter—slowing water, cleaning it, and releasing it gradually. Good soil structure, organic matter, and root systems create pores that take in water, store it, and share it with plants and aquifers over time.
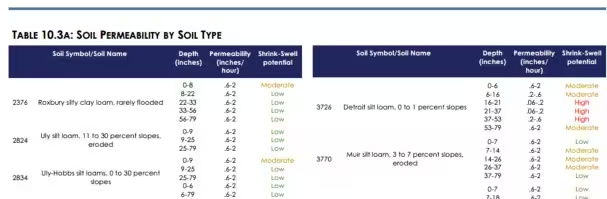
Thayer County’s plan introduces USDA’s hydrologic soil groups and permeability ratings explicitly, noting that soils are grouped from low to high runoff potential and that shrink–swell potential and saturated hydraulic conductivity together determine whether water will infiltrate, sit, or race off the landscape. Tables in the chapter highlight Hastings and Crete series with high and very high shrink–swell potential at depth, and Scott and Fillmore series with very slow permeability and frequent ponding—exactly the soils that amplify flood peaks and challenge foundations when development ignores their limits.
Heavily compacted or disturbed soils do the opposite: they shed water quickly, increase runoff velocity, raise flood peaks downstream, and reduce the groundwater recharge that sustains wells and streams between storms. Climate studies have shown that increased rainfall over decades can actually reduce infiltration rates when soils are repeatedly disturbed or compacted, leading to more runoff and erosion even as total precipitation rises. That’s the paradox of poorly managed landscapes: more rain, less water where you need it, and more risk where you don’t.
Development patterns that ignore soil capacity don’t just create local problems. They redistribute risk—downstream, to neighboring landowners, and to future generations who inherit the infrastructure and drainage obligations those decisions create. When a county allows low‑density development on soils with poor infiltration and high runoff potential, it is quietly deciding who gets flooded and where public dollars will be spent twenty years from now. That is a choice better made in the comprehensive plan than in the emergency operations center, with soil maps and hydrologic data in hand rather than sandbags on the street.
Healthy soils also support resilience on the agricultural side. Practices that improve soil health—cover crops, reduced tillage, diversified rotations—help keep water where it falls, reduce erosion, and stabilize yields under more variable weather. Linking soil health goals in the agricultural strategy to land use decisions that protect prime soils and limit fragmentation creates a coherent resilience story: the same soils that buffer floods and recharge groundwater also feed people and support rural economies.
Closing the Gap Between Data and Decisions
The gap between having soil data and using it is mostly a process problem. Adding soils maps to your plan is the first step, not the last. To close the gap:
- Add soils maps to your plan—and reference them elsewhere. A soils map in the natural resources chapter that is never mentioned in land use, subdivision, or infrastructure chapters isn’t doing any work. Cross‑reference it explicitly. I was fortunate to work with a planner at MPC who is very, very good with GIS and the extensive soils layers.
- Build soil limitations into staff review checklists. Planning staff reviewing rezoning and subdivision applications should routinely pull Web Soil Survey for the subject parcel. A one‑page summary of soil ratings attached to the staff report becomes part of the record, part of the conversation, and ultimately part of the decision.
- Partner with your local NRCS office. NRCS staff are technical experts who want local governments to use their data well. Many offices will participate in planning workshops, review draft plan chapters, or provide GIS layers for mapping at no cost.
- Require site‑specific investigations for constrained sites. For proposals on soils rated Somewhat Limited or Very Limited for the intended use, make sure your zoning & subdivision regulations require a professional soil investigation with applications. This shifts the burden of proof to the applicant and protects the county from future liability, while keeping NRCS’s role where it belongs—science provider, not regulator.
Across Jefferson, Clay, Thayer, and Hall counties here in Nebraska, the comprehensive plans we helped write also made common practice explicit: they remind readers treat soil tables and appendices as part of the plan by reference, noting in the natural resources chapter that the text, graphics, tables, and maps “are made part of this Comprehensive Plan by reference,” and that true and correct copies are on file with the County Clerk. That sentence turns NRCS soil limitations and permeability data into adopted, citable planning context—ready to be cross‑referenced in subdivision standards, floodplain regulations, and future land use policies.
These are simple process changes. They don’t require new science; they require new habits. That’s the space where a comprehensive plan can quietly change how a county uses the data it already owns—moving soils from the back of the chapter to the front of the policy conversation, and from static maps to active decisions about where the land should grow, where it should stay in production, and where it should be left alone to do the slow, quiet work of resilience.

Conclusion – Planning With the Ground Beneath Your Feet
Comprehensive planning has always been about more than coloring between the lines on a future land use map. It is, at its best, an exercise in humility—recognizing that the land already has a logic, and that our policies either respect that logic or try to pave over it. Soil surveys are one of the clearest statements of that logic we have. They tell us, in plain technical language, where the ground will carry our infrastructure easily and where it will undermine it a little more every year.
If we treat those maps and tables as scenery, we will keep approving subdivisions on Very Limited soils and then wonder, a decade later, why the maintenance budget never quite catches up. If we treat them as infrastructure, we will start asking different questions at the front end: not just “Is this use allowed?” but “Given what we know about these soils, is this where growth belongs?” In my experience with Nebraska counties, the places that make that shift don’t stop growing. They just grow in ways that line up better with the land they have.
Before counties decide what they want the land to become, they should understand what the land already is. The soil survey has been making that case for decades, quietly, in appendices and map books and Web Soil Survey areas of interest. It deserves a seat at the table in every major land use decision a county makes. Next Sunday, we’ll move from what’s underfoot to what flows through it: surface water, groundwater, and the land use decisions that affect both.
Questions about how to use soil data in your comprehensive plan? Get in touch.
I will be speaking at the Inland Northwest Partners Summer Meeting Thursday, the 9th of July, on the Eastern Washington University (EWU) Campus in Cheney, Washington. Topic: Measuring Success on Main Street. Info here: https://inwp.org/events/ .

Further Reading
The soil survey data referenced in this article is free, publicly available, and already covers your county. The resources below will help you go deeper — whether you’re looking for technical guidance on reading soil ratings, policy frameworks for protecting prime farmland, or the broader case for why soil deserves a central role in land use planning.
Books
- Growing a Revolution: Bringing Our Soil Back to Life — David R. Montgomery (W.W. Norton & Company, 2017)
Practical and accessible look at soil health, land management, and the long-term costs of treating soil as an inert surface rather than a living system. - Dirt: The Erosion of Civilizations — David R. Montgomery (University of California Press, 2007)
A compelling account of how soil loss has shaped the rise and fall of societies. Makes the case for treating soil as a finite and irreplaceable resource — exactly the argument planners need to make to elected officials. - Site Planning — Kevin Lynch (MIT Press, original 1962; my copy 3rd edition, 1984; Kindle-link Patavium, 2023)
The essential textbook for site planning, including technical information on soils and soil conditions. - Soil and Land Use Change — Javid Ahmad Parray, ed. (Springer, 2025)
Covers a range of areas of global significance; expensive textbook, check an academic library..
Tools & Data
- USDA Web Soil Survey — Free, publicly accessible soil data for every county in the U.S. The starting point for any soil-based planning analysis.
- NRCS Soil Surveys Can Help You — Overview of how soil survey data applies to land use planning, development review, and conservation.
- NRCS Web Soil Survey — Getting Started — Step-by-step guide to using the Web Soil Survey for your county or area of interest.
Reports & Research
- Farms Under Threat: The State of the States — American Farmland Trust’s state-by-state analysis of prime farmland loss and the policies that can prevent it. Essential context for any comprehensive plan chapter on agricultural land protection.
- Farms Under Threat 2040: Choosing an Abundant Future — Projects farmland loss scenarios to 2040 under different development patterns. Directly relevant to the argument for directing growth away from prime soils.
- USDA Soil Survey Manual (Handbook 18) — The authoritative technical reference for soil survey methodology and interpretation. Chapter 8 covers land use interpretations specifically.
Planning Guidance
- Sustaining Places: Best Practices for Comprehensive Plans (APA PAS Report 578) — APA’s framework for integrating natural systems — including soils — into long-range comprehensive planning.
- Land Use Analysis: Natural Resources and Soils — University of Wisconsin resource guide chapter on incorporating natural resources and soils analysis into comprehensive planning practice.
- Check out Small Town and Rural Community Guide to Conservation and the Great Outdoors (PDF). Let us know if you would like to see more Community Guides to share ideas and resources from jcshepard.com.
This page contains affiliate links. As an Amazon Associate, JCShepard.com may earn from qualifying purchases at no additional cost to you. Check your local library.
Rural-Ready Engagement: Practical Tools for Small Town Planners
 Watch the full replay: youtube.com/@Engaging-Communities (February 2026)
Community engagement can look very different in small towns and rural communities. This webcast was co-sponsored by the APA Community Engagement Interest Group and the Small Town & Rural Planning Division.
Dynamic Decisions Podcast (Season 2 Episode 15)
“Stop Chasing Smokestacks. Grow What You Have” with Teasha Cable of cModel Data, now playing on Youtube (audio), Apple Podcasts, Spotify (May 2026). Other listening links here.
The Rural Impact Podcast (Episode #86)
“Pathways to Powering Rural America” My guest spot on Michelle Rathman’s podcast. Episode page here, listen on Apple Podcasts or Spotify, or watch (!!!) on youtube. We talked about energy, data centers, and good governance, plus so much more.
Popular posts on JCShepard.com
- The Planning Process—From Vision to Action in Small Towns and Rural America (January 2026)
- Small Towns Can Build a Strong Outdoor Economy Without Selling Out (June 2026)
- Historic Preservation and Rural Economic Development: A Rural Growth Strategy (April 2026)
- Main Street America and the Revival of Downtown (June 2026)
- Reviving Rural America: Why Heritage Tourism Is a Game-Changer Now (September 2025)
- What is Economic Development in Modern America? A Field Guide for Small Towns and Rural Places (March 2026)
- The Rise of Rural Entrepreneurship: Building Economies from the Ground Up (January 2026 on Medium.com)
- Rural Recreation and the Outdoor Economy: Trails, Fairs, Community Identity (May 2026)
- Rural Housing Supply Crisis: Why Small Towns Are Running Out of Homes (February 2026)
- Powering Rural America: The Full Energy Picture in 2026 (June 2026)
- Community Facilities: Why We Need to Rebuild Our Foundations (April 2026)
- Small Towns, Big Impact: How Rural Communities Are Designing Their Own Futures (November 2025)
- The Rural Comeback: How Small Town Innovation Sparks Growth (August 2025)
Check out The 12 Planning & Sustainability Books You Need in 2026 and browse through the Small Town & Rural Community guides on our Resources page.