
Who Can Afford to Live Rural? Global Pressures on Small-Town Housing Markets
The rural housing market is more of an idea than a thing. Housing supply and needs vary considerably across nations and regions, let alone around the world.
Today’s post builds on our February theme of demographics and housing trends, and implications for rural development. We’ll discuss demographics and housing markets in the US, Canada, and around the world, then delve more into rural areas in those regions. We’ll take a deeper dive into rural housing trends here in the US—it’s where I’m at, but we still face very different regional outlooks across the country.
We will also take a quick look at some rural places in the US and Canada who are doing some interesting things to meet current housing needs, as well as review housing elements in a couple recent plans I’ve worked on in the Midwest and Southwestern US. This all sets the stage to talk about some more broad housing ideas in next week’s installment of this series.
Demographics and Housing Markets
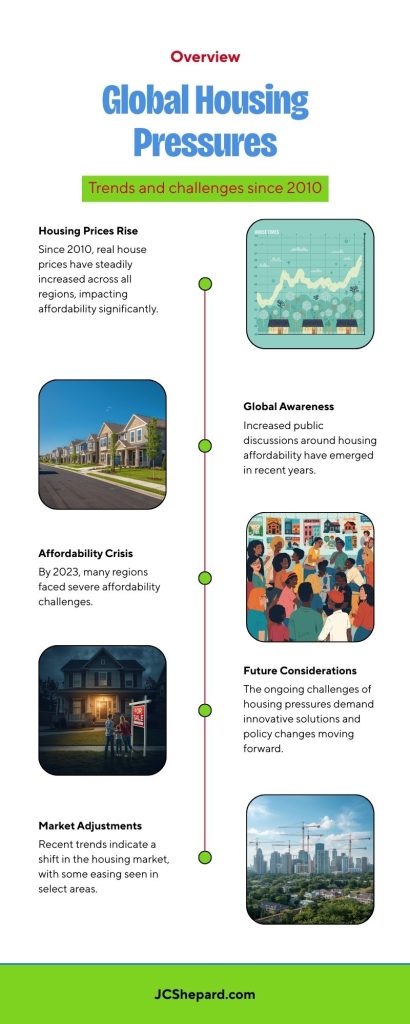
Across the US, Canada, and other developed countries, housing markets have cooled from the pandemic boom but remain historically expensive, while global prices overall have flattened in real terms, with big regional differences. Demographic forces—aging populations, smaller households, and migration—are now as important as interest rates in shaping demand, location preferences, and affordability.
A Snapshot from Around the World
United States
After sharp gains 2020–2022, U.S. housing price growth has slowed to around low‑single‑digits annually, with inventory rising but still below pre‑2019 norms. The most recent reports from the US Census Bureau American Community Survey (ACS) report 146,740,964 housing units in the United States in 2024 (one-year estimates), with a 9.5% vacancy rate. This is up from 139,686,209 housing units in 2019, with a 12.1% vacancy rate.
As Harvard University’s Joint Center for Housing Studies reports, “The number of cost-burdened households rose to record highs in 2024 as housing affordability remained a widespread challenge… Fully 20.7 million homeowner households faced cost burdens in 2024 (24 percent of all homeowners.” Existing home sales picked up in late 2025, suggesting some stabilization with mortgage rates more predictable and buyers gradually returned in many areas.
The US housing market is a mosaic of many different local markets where conditions vary, with modest gains in much of the Midwest/Northeast, mild declines in parts of the Southwest and Southeast. Recent research by the Federal Reserve suggests some of these differences derive from unique drivers from both income and population gains:
“Places where economic growth translates into strong demand for highly skilled workers, such as San Francisco, will tend to have more growth in house prices and less growth in housing supply relative to places where there is very little income growth but significant growth in middle- or low-income jobs, like Houston. Critically, these growth dynamics are independent of housing supply constraints and so are more likely to reflect deeper trends in the underlying drivers of economic growth.”
Canada
Statistics Canada reports indicate there were 16,284,235 private dwellings in Canada in 2021, with a vacancy rate of about 8.0%. The Canada Mortgage and Housing Corporation (CMHC) reports the most recent rental housing vacancy rate stands at about 3.1% at the end of 2025, which was actually above the 2.2% rate for 2024.
CMHC has also reported rural housing costs surged 20% from 2020 to 2023, driven by remote work and urban-to-rural migration. More recently the market has shifted into a flatter phase. Through 2025, sales volumes were subdued for much of the year, with a “quiet” end to 2025 and national average prices roughly unchanged year‑over‑year (about CAD 673k, down 0.1% versus December 2024), and benchmark indexes showing modest declines, especially for condos and townhomes. Regional patterns diverge: some metros (e.g., parts of Vancouver/Montreal) show renewed activity, while others remain weak.
Organization for Economic Co-operation and Development (OECD)
Across the OECD—a set of 38 mostly developed, market-based economies—real home prices have risen by more than 40% on average over the last decade, with the steepest acceleration during the pandemic. Since 2022, higher interest rates have cooled many markets, but levels are still elevated and affordability has worsened almost everywhere; social and affordable housing stocks have lagged demand after years of under‑investment. Within the OECD, some advanced economies (e.g., Australia, Mexico, the US) still showed rising real prices into 2024, while others (e.g., Italy, parts of Europe, Korea) have seen real declines.
Global picture
In real terms, global house prices were down about 1% year‑over‑year in early 2024, an improvement from steeper falls in 2023, with nominal prices still rising around 3% globally. Advanced economies have nearly stabilized in real terms (about −0.3% year‑over‑year), while emerging markets showed larger real declines (about −1.6%), masking wide country‑level variation.
Demographic Forces Reshaping Demand
As we discussed in our last post, demographic shifts across global markets are mainly affect housing markets through three channels: age cohort size, household formation, and location choice.
Aging populations and smaller households
OECD countries are aging rapidly; older generations (55–64 and 65+) have seen stronger income and wealth gains than younger adults since the mid‑1990s, largely due to asset price appreciation including housing. As large baby‑boomer and Gen‑X cohorts age, they hold a growing share of owner‑occupied stock, often in larger, mortgage‑free homes, limiting turnover and keeping supply tight in desirable neighborhoods.
Demographic change impacts housing markets when large cohorts reach prime home‑buying ages (roughly 30s–40s); they tend to push up prices 25–30 years after their birth, especially when supply is inelastic. As these cohorts age beyond typical ownership growth years, their reduced net demand can eventually dampen price growth, though effects are gradual and context‑dependent.
Smaller average household sizes—more singles, later marriage, fewer children—raise the number of required dwelling units for a given population, supporting demand for apartments and smaller homes in cities across the OECD.
Youth cohorts, affordability, and ownership
Younger generations in OECD countries face high house prices relative to income, tighter credit, and unstable labor markets, which delay homeownership and family formation. The OECD notes that wealth and income gains have favored older cohorts, shifting poverty risks toward children and younger adults and making it harder for them to accumulate housing wealth.
Empirical work for OECD economies suggests that demographic shocks increasing the share of young adults raise demand and prices when credit is available, but in credit‑constrained settings, aging can have a clearer negative effect on house prices. This helps explain why some older, slower‑growing European countries have seen weaker house‑price dynamics than younger, faster‑growing economies before the recent rate‑driven cooling.
Migration and urbanization
Migration (both international and internal) offsets aging in some OECD countries and cities, boosting population and housing demand especially in large metros. The OECD estimates that higher net migration rates can modestly improve GDP per capita growth and help support labor supply, which indirectly sustains housing demand, though migration is “not a game changer” without unusually high inflows.
Urbanization and the concentration of high‑productivity jobs in major city‑regions increase demand for central locations and transit‑connected suburbs, pushing up prices and rents relative to national averages in both advanced and emerging economies. This drives a structural tilt toward multifamily and smaller units in big cities, while some low‑growth rural or shrinking industrial regions see stagnant or falling prices despite national booms.
Demographics and Housing Markets
United States
Aging homeowners with accumulated equity constrain supply because many are “locked in” to low‑rate mortgages and prefer to age in place, which keeps listings low even as demand cools. At the same time, large Millennial and Gen‑Z cohorts moving into peak household‑formation years maintain underlying demand for starter homes and rentals, especially in affordable metros and Sun Belt areas, even where prices have stopped rising.
Migration patterns—outflows from high‑cost coastal metros toward cheaper regions and smaller cities—are reshaping local markets, contributing to mild price declines in some previously hot Sun Belt areas and renewed growth in more affordable Midwest/Northeast cities. Urban preference among younger workers supports multifamily construction and rental demand in job‑rich metros, even as single‑family demand shifts to exurbs and secondary cities.
Canada
Canada combines strong population growth (including relatively high immigration) with constrained housing supply in major metros, which helped push real prices up more than 50% since 2010. Even as higher interest rates have cooled prices and volumes since 2022, population growth keeps underlying housing demand robust, limiting how far prices can fall in large cities.
Younger and newcomer households gravitate to large urban centers for work, intensifying demand for condos and rentals, while aging homeowners often remain in single‑family homes in established neighborhoods, constraining the stock available to buyers. The result is a structurally tight market in key regions—high prices and rents, minimal vacancy—even during cyclical slowdowns.
Rest of OECD
Many European and East Asian OECD members face aging and in some cases shrinking populations, which over time can dampen aggregate housing demand, particularly in peripheral and rural areas. However, within countries, large cities still attract young workers and migrants, so urban markets remain tight and expensive even as some regions experience low prices and excess supply.
Research comparing OECD and non‑OECD markets finds that aging tends to put downward pressure on house prices when credit is constrained, but where credit and investment demand remain strong, older cohorts’ wealth can sustain high price levels. This helps explain why countries with aging but wealthy populations and strong financial systems can still have high housing valuations, despite slow population growth.
Global trends and demographic impact
Globally, housing markets have transitioned from synchronized post‑pandemic booms to a more mixed environment where interest rates, demographic profiles, and credit conditions lead to very different outcomes across countries. Advanced economies, many with aging populations and mature credit systems, show a stabilization in real prices at high levels, while some emerging markets with younger populations but weaker economies see sharper real price corrections.
Demographic pressures on affordability are especially acute in high‑income, high‑migration hubs—large OECD cities where young workers and migrants compete for limited housing, while older, wealthier households already own property and benefit from past price run‑ups. In contrast, regions facing depopulation and rapid aging may struggle with under‑demand and falling prices, raising different policy challenges such as managing vacant housing and infrastructure costs.
Policy and Planning Implications
The current housing affordability crisis is generally considered to be a result of strong demographic and urbanization pressures, which reduce disposable income, constrain labor mobility, and increase inequality, combined with under‑investment in public affordable and private attainable housing. As populations age and younger households struggle to buy, there is growing emphasis on policies to expand affordable supply (infill, higher density, public social housing), support rentals, and adapt housing stock for older residents.
For planners and policymakers, a key is to consider housing markets as a product of monetary policy and long‑run demographic structure. As Federal Reserve research has suggested, an increase in income typically creates demand for higher quality housing. An increase in household formation typically creates demand for more housing units. Even if interest rates normalize in the near-term, aging, migration, and household‑formation patterns will continue to drive where long-term demand is strongest and where prices remain under pressure.

How are Rural Housing Markets Doing?
In most of developed countries, urban housing is far more expensive and space‑constrained than rural housing, but since 2020 rural prices have risen unusually fast—especially in the US—narrowing the traditional gap in many regions without eliminating it. Globally, big cities remain the epicenter of affordability stress, while some rural and remote areas are now feeling a new squeeze from in‑migration, second homes, and changing work patterns.
United States: rural catch‑up, urban still pricier
Over the course of the pandemic, the US housing market added abut 5% more units nationwide (2019-2024, based on ACS 5-year running averages). At the same time, the number of non-metro housing units stayed steady (actually contracting, due in part to reclassification of MSA counties).
That trend varies greatly across the country, yet is reflected in inflationary pressures on rural housing nationwide. From 2019 to late 2025, median listing prices in non‑metro (rural) US counties rose by more than 70%, more than double the just‑over‑30% increase in metro counties. Some rural counties saw extreme gains of 120–160% as remote‑work households and retirees sought cheaper space and small‑town amenities.
Even with this surge, median rural sale prices remain well below large‑metro levels (roughly high‑$200k vs much higher in coastal metros), so rural housing is still more affordable in absolute terms. As documented by the University of Minnesota Rural Heath Research Center in 2024, one-third of urban households are “housing cost‑burdened” (spending 30%+ of income on housing) compared with one-quarter of rural households nationwide. This share is remarkably consistent across the country, with California, Hawaii, and Massachusetts having particularly high rates of cost-burden among both urban and rural households.
Rural markets face different stresses: limited rental stock, constrained construction capacity, and lower wages—rural earnings are under 85% of urban earnings—so rapid price gains can quickly price out long‑time residents even if nominal prices are lower than in cities. In some rural counties with many second homes or vacation properties, prices jumped nearly 50% from 2020 to 2023, tightening supply for year‑round residents.
Canada: metro pressure, rural spillovers
Canada’s overall market has softened since 2022, but the long‑run story is intense pressure in large metros (Toronto, Vancouver, Montreal) with chronic supply shortfalls, while smaller cities and rural areas remain cheaper but increasingly affected by spillover demand. National agencies project Canada needs millions of new homes by 2030 to restore affordability, with much of that need concentrated in and around major urban centers.
Urban markets in Canada carry the highest prices and worst affordability; benchmark prices in big metros remain far above national averages even after recent declines. Smaller cities and rural areas have lower prices but often face limited rental options and tight resale inventory, particularly in attractive amenity regions (lakes, mountains, exurban belts) that draw urban buyers.
As population growth and immigration remain strong, demand radiates outward along transit corridors and highways, pushing up prices and land values in exurban and rural communities accessible to metro job markets. That dynamic can leave truly remote rural regions with stagnant or weak markets, while “commuter‑rural” zones and recreational areas see faster appreciation.
Europe and the OECD: expensive cities, uneven rural trends
Across Europe and the rest of the OECD nations, rural areas generally face less severe cost burdens than big cities but still struggle with quality, under‑occupation, and depopulation, and only a few countries or regions can be described as broadly “matching” rural housing needs with supply. EU data show about 10% of people in cities are “housing cost overburdened” versus about 6% in rural areas. This gap reflects strong job and income growth in major metros plus land‑use and supply constraints that prevent housing from keeping up with demand.
Rural Northern/Western European countries (Nordics, Germany, Netherlands, Austria) tend to have relatively good basic housing standards but diverge in affordability and vacancy patterns. Social and cooperative housing sectors are large in Austria, Denmark, the Netherlands, Finland, France, and Ireland, often covering 10–20% of the stock, which supports more balanced markets in many non‑metro areas.
At the same time, built‑up areas in remote regions with declining populations expanded by about 11% between 2010 and 2020—faster than in fast‑growing metropolitan regions—indicating suburbanization and exurban growth even where population is flat or falling. In Spain and parts of Italy, some inland rural regions face depopulation and under‑used stock, while coastal and tourist regions face high second‑home demand and shortages of affordable year‑round housing. These patterns often yield pockets of oversupply or weak demand in some rural/remote areas, alongside acute shortages in dynamic city‑regions.
As we discussed in last week’s post on demographics, parts of Europe and East Asia are facing more advanced aging and depopulation. Southern European countries show a mix of urban affordability crises and rural mismatches. These trends have kept prices subdued or even falling in rural areas, while capital cities and large metros remain highly unaffordable. Even many rural German and Nordic regions face issues of aging populations and scattered settlement but benefit from strong building standards and renovation programs that keep a lot of rural stock usable.
Typical rural issues include vacant homes, under‑maintenance of older stock, and limited financing. In particular, since the pandemic, many urban investors have bought up older homes in small, rural communities as an escape from major metro cities. At times in response to increased housing standards for long-term rentals, many of these homes end up as short-term rentals, even in areas with limited tourism pressures. There are also issues with abandoned homes tied up in inheritance disputes and for other tax reasons.
Global Rural–Urban Housing Trends
In developed economies, a decade‑long pattern of worsening affordability has been driven mainly by urban and metropolitan markets, where prices rose faster than incomes through 2014–2022. In 2023–2024, affordability improved slightly in many countries as incomes finally grew faster than house prices, but this relief was modest and did not erase the urban affordability crisis.
Globally, the pandemic accelerated a “donut” effect: higher relative demand for suburban, exurban, and some rural locations as remote work loosened the tie between jobs and city‑center living. This produced unusually strong price growth in rural counties in the US and in amenity or commuter rural regions in other countries, while city prices stayed high but decelerated.
In lower‑income and some emerging‑market contexts, urbanization continues to pull people into cities, sustaining strong demand and price growth in urban housing while many rural areas face long‑term out‑migration and weak markets. The net effect is a more complex global map: large cities remain the focal point of high prices and rent burdens. Even so, select rural and small‑town markets—especially those with amenities, good connectivity, or tourism—are now experiencing big‑city‑style affordability pressures.
The Rural Trendline in the US
For American outside metropolitan areas, the biggest housing shortages are in fast‑growing rural counties—especially those tied to tourism, energy, retirement, or commuting to metros—while surpluses show up in depopulating regions such as parts of Appalachia and the rural Great Plains. The tightest gaps are usually in affordable rentals and smaller homes, whereas oversupplied places often have older, larger, or poor‑quality units that do not match today’s smaller, lower‑income, or older households.
Regional Patterns in Rural US
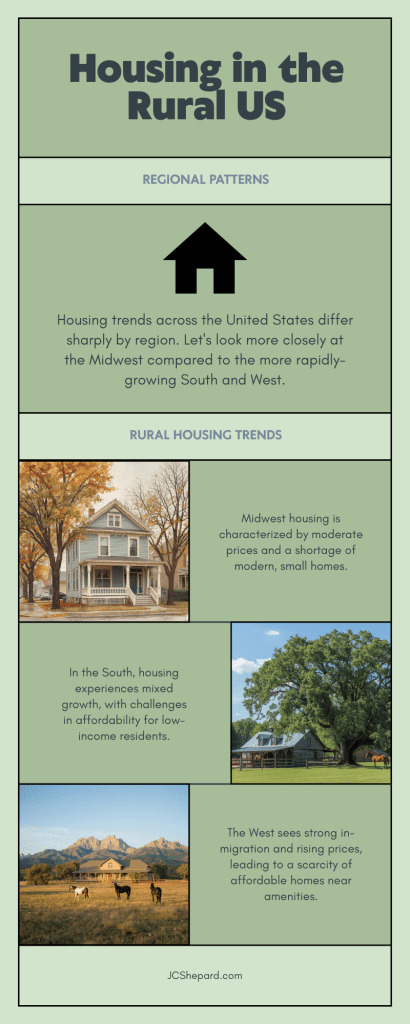
Rural population trends across the United States differ sharply by region. US Census and USDA reports document the many rural counties in the Great Plains and parts of the Midwest where small towns and unincroporated areas continue to lose population. At the same time rural counties in the South and West—especially those near metros or with amenities—have gained residents. Areas with population growth show stronger price increases and tighter vacancy, while long‑term population loss is associated with higher vacancy and weaker demand.
Housing cost burdens in rural areas are highest in parts of the Northeast and Mountain West, and lower on average in much of the Midwest and parts of the South. Rural New England states (e.g., Massachusetts, Connecticut) and high‑amenity Mountain West states (e.g., Colorado) have some of the highest rural cost‑burden rates, often above 30–40% of households.
A 2025 study by Neighbors Bank found rising competition and shrinking inventory have made many rural markets “feel” like urban ones: lower‑cost rural counties now attract remote workers and retirees, pushing up prices faster than local incomes. That competition is most intense in nonmetro counties near large job centers or with desirable natural amenities.
Where Rural Housing Shortages are Most Acute
In rural areas, “shortage” usually means not enough affordable, habitable, appropriately sized units, rather than too few physical structures overall.
Types of shortages
Affordable rental housing:
USDA and Housing Assistance Council reports emphasize that deeply affordable rentals for low‑income, elderly, and disabled residents are in particularly short supply. The federally supported Section 515 rural rental portfolio is aging, shrinking, and “often the only decent and affordable rental housing” in many communities.
Small, modest ownership units:
In many regions, much of the stock is older single‑family homes that are too large, in poor condition, or too far from services for single‑person or older households. Reports for Central Appalachia note a mismatch between large, aging homes and the growing share of one- and two‑person households who need smaller, more efficient units.
Quality, code‑compliant housing:
Substandard housing (weatherization, plumbing, structural issues) remains concentrated in some rural regions, so even where there is nominal “supply,” families cannot safely occupy many units without major rehabilitation.
Places with the greatest rural shortages
Evidence is patchy and report‑based rather than a single national ranking, but several nonmetro patterns are clear:
Rural Northeast and New England:
Rural households in states like Massachusetts and Connecticut show some of the highest housing cost‑burden rates in the country; shortages focus on affordable rentals and small homes for lower‑income and aging residents. Production has been strongest in metro cores, leaving rural and exurban towns with limited new stock and rising prices.
Mountain West and amenity rural counties (e.g., CO, MT, ID, UT):
High demand from migrants and second‑home buyers plus limited construction capacity has led to tight inventories and rising cost burdens even in historically “cheap” rural areas; Colorado’s rural areas are cited among the top cost‑burdened rural places.
Central and Southern Appalachia (nonmetro parts of KY, WV, VA, TN, AL):
A 2023 housing‑needs report finds that previously weak markets have tightened, creating shortages of affordable, appropriately sized units in many communities. The report highlights unmet need for smaller multifamily and small single‑family units to fit one‑person and older households, as well as for better‑quality rentals.
Farmworker and agricultural regions (e.g., Central Valley CA, parts of TX, the Southeast):
USDA notes ongoing need for farm‑labor housing; Section 514 farm labor housing funding increased in 2024, reflecting recognized shortages of decent, affordable units for seasonal and migrant workers.
Rural areas with surplus or under‑used housing
“Surplus” generally appears where long‑term population decline and weak labor markets leave more units than households, often with elevated vacancy.[1]
Appalachia overall:
The Appalachian Regional Commission reports that housing unit vacancy in the Appalachian region is 3.4 percentage points higher than the national average, even though homeownership and cost‑burden rates are not especially high by national standards. This indicates pockets of surplus or under‑used housing, often older single‑family homes in small towns and hollows, even as some sub‑regions of Central Appalachia now face tighter markets.
Great Plains and parts of the rural Midwest (e.g., KS, NE, SD, ND):
USDA’s “Rural America at a Glance” highlights continuing population decline in many Great Plains rural counties, associated with aging residents and out‑migration of young adults. In such counties, vacancy can be high, with surplus older single‑family units and farmhouses that may be poorly maintained or far from services, making them unattractive even at low prices.
Some Delta and interior rural South communities:
Although detailed vacancy data vary by county, a mix of persistent poverty and slow growth leaves some small towns with relatively high vacancy rates and low prices. In these places, the surplus is often in older, low‑quality single‑family stock and mobile homes that are difficult to finance or repair.
In surplus regions, the central issue is often quality and economic viability, not the raw number of units. Rehabilitation, weatherization, and small‑scale infill can be more relevant than new construction.
How Rural Trends Differ By Region
Putting it together, rural housing trends diverge along two main axes: population and income growth (or decline), and the structure/age of the existing housing stock.
Growing, high‑demand rural regions (shortages)
Examples:
Nonmetro counties in the Mountain West, New England vacation areas, some coastal/riverside amenity counties, and rural counties within commuting distance of major metros.
Typical market signals:
Fast price appreciation, shrinking inventory, rising cost burdens for renters and first‑time buyers, and more frequent competition from second‑home/remote‑work buyers.
Biggest missing pieces:
Affordable rentals, small single‑family or townhouse units, workforce housing for service and care workers, and accessible units for older adults.
Stable or modest‑growth rural regions (mixed conditions)
Examples:
Many rural counties in the Midwest interior, parts of the rural South not tied to major tourism or energy hubs.
Market signals:
Moderate price growth, affordability issues mainly for renters, and persistent but less extreme shortages of quality lower‑cost rentals.
Missing pieces:
Rehab of aging stock, incremental infill, and preservation of older USDA‑assisted properties as mortgages mature and affordability restrictions expire.
Depopulating or structurally weak rural regions (surpluses)
Examples:
Parts of Central and Northern Appalachia, some rural Great Plains and Midwest counties, and selected Delta communities.
Market signals:
Higher vacancy, slow or flat prices, older residents, and limited new construction.
“Surplus” types:
Older single‑family homes, sometimes large for current household sizes; units needing significant repair; and properties in locations with weak job prospects.
Essentially, many nonmetro counties have physical surplus of housing stock, while at the same timey they have functional shortages: a lot of older, under‑maintained single‑family homes and limited small, high‑quality rentals or starter homes matching the needs of smaller, older, or lower‑income households.
Let’s take a closer look at the rural Midwestern United States, compared to faster growing areas in the South and West.
Midwest Housing Trends
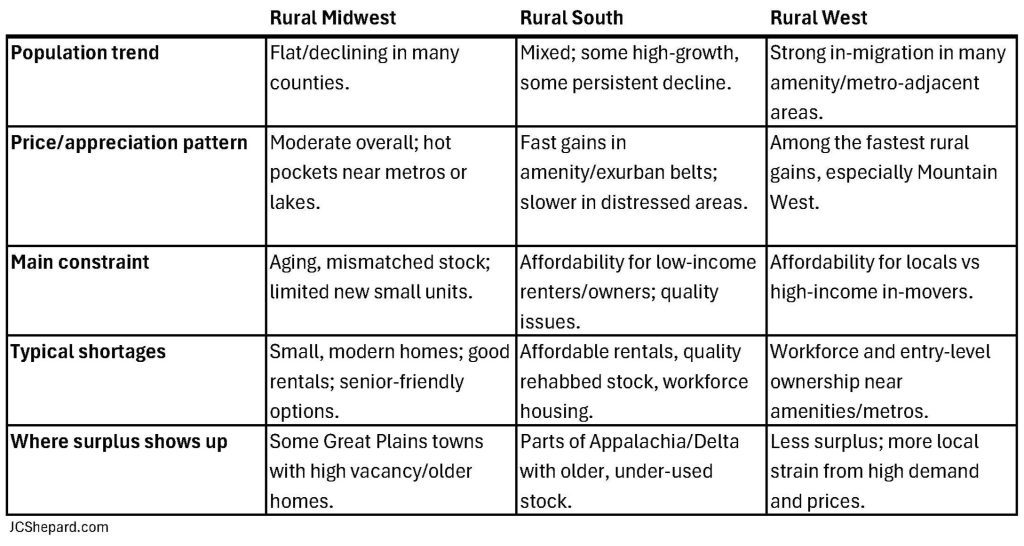
In rural America, the Midwest looks more “stable but tight,” while the South and West show faster growth, more volatility, and sharper affordability strain—especially in high‑amenity or fast‑growing counties.
Big picture: all rural, but not the same
Nationally, rural prices have jumped about 60% since before the pandemic, a larger increase than in urban areas, and affordability has eroded fastest in rural America overall. But within that, rural Midwest, South, and West diverge in growth, pressure, and housing types in demand.
Rural Midwest
Depending how we define the region, many nonmetro Midwest counties (Great Plains, upper Midwest) are slow‑growth or shrinking, with aging populations and out‑migration of younger adults. That keeps construction modest and can leave older single‑family stock under‑used or in need of rehab, even as certain towns face local shortages.
A farm‑economy lens matters: farmland values surged from 2019–2023, then softened in 2024 and firmed again in early 2025, supporting ag land prices. Rather than supporting investments in town, higher raw land prices may rather keep land out of development—good for preservation of agriculture, yet not so good for opening up new building lots. Many Midwestern rural communities “struggle to expand and/or update their housing stock” despite relatively slow population growth, leading to tight availability of newer, accessible, or smaller units.
The result is in a lot of rural Midwest places prices are lower than other regions, but it’s still hard to find move‑in‑ready, energy‑efficient smaller homes or good rentals. The constraint is quality and type rather than raw number of structures.
Rural South
The rural South includes two different stories: high‑growth areas (exurban belts around metros; coastal, lake, or mountain‑amenity counties) and persistently poor regions (parts of the Delta and Appalachia). The first group has seen strong in‑migration, fast price growth, and shortages of workforce and starter housing; the second has more stagnant prices, older stock, and sometimes elevated vacancy.
Cost burdens for low‑income rural renters and owners are high in much of the South, with a large share of households spending 30%+ of income on housing, often in manufactured housing or aging single‑family units. Where tourism and retirement demand are strong (e.g., parts of the Carolinas, Tennessee, Gulf Coast), rural markets can feel “urban‑tight,” with pressure on rentals and small owner units.
Rural West
Western counties—especially in the Mountain West and Intermountain West—have seen some of the sharpest rural price escalations in the nation because of migration, second homes, and lifestyle moves. Studies flag Colorado rural areas, in particular as among the most cost‑burdened, with high shares of renters paying more than 30% of income on housing.
There’s a reason I left Colorado for the plains of Nebraska. Miss fly fishing… don’t miss the cost of housing.
Demand is strong for larger lots and scenic locations across the West. Yet incomes in local service economies tend to lag, so even “modest” homes become unaffordable for local workers. New construction happens, but land, labor, and regulatory constraints mean it frequently targets higher‑income, short-term rental, or second‑home buyers rather than local workforce housing.
Upgrading and Right-Sizing
In the current environment, rural Midwest markets are more about upgrading and right‑sizing an aging stock, while rural South and especially rural West are more about managing rapid demand and affordability pressure, with pronounced hot spots around metros, tourism, and amenity corridors.

Is Anybody Here Doing Rural Housing Right?
Yes, it does seem there are rural places in the US and Canada that are doing a reasonably good job of meeting current housing demand, though they are the exception rather than the rule and usually rely on targeted local or programmatic efforts.
United States: Examples and Patterns
Federal programs (especially USDA Rural Development) have helped hundreds of thousands of rural households buy, build, or repair homes even over the pandemic. These programs have materially eased unmet demand in some communities. Successes are scattered: they show up where local governments, nonprofits, and lenders actively use tools like USDA Single Family Direct Loans, Section 502 guarantees, and repair grants to keep owner‑occupied housing available and habitable.
State and Local programs also continue to facilitate home improvement and, where necessary, clearance of blight conditions. In Ord, Nebraska, for example, the local Valley County Economic Development organization has invested in improving housing quality and availability, in part through abatement of vacant property. They have also worked with local government on an infill housing rebate used to fix up abandoned or dilapidated pre-existing housing stock in their rural home town. Through 2025, the program has realized five rebates totaling about $138,000, leveraging over $1 million in housing improvements in the County Seat.
Some tribal and remote communities have created models that are effectively matching demand for specific groups. For example, the “Success Starts with Me” initiative of the Tlingit Haida Regional Housing Authority in Southeast Alaska pairs flexible lending with financial education so tribal citizens can attain homeownership in their own communities, filling a gap that conventional mortgages do not serve. Enterprise Community Partners highlights this and similar models as scalable examples of rural and tribal housing innovation that align new supply and financing with local demand rather than generic suburban products.
At a more everyday level, there are small‑town workforce‑housing efforts that are beginning to catch up with demand. In rural Iowa, the builder Origin Homes pivoted in 2024 from purely custom homes to explicitly building “workforce housing” in multiple small towns, with local employers and civic leaders framing housing as essential economic infrastructure. Local accounts describe this as starting to stabilize worker recruitment and keep younger families in these towns, suggesting new supply is better matching demand than in many peer communities.
In short, where rural US places are “meeting demand,” it tends to be:
- Small or mid‑sized towns with active local leadership and partnerships.
- Heavy use of USDA and state programs for ownership and rehab.
- Purpose‑built workforce or tribal housing that is sized and priced for local incomes.
Canada: Small‑town Successes
Canada’s rural and small‑town housing markets are tight overall, but there are notable examples where targeted strategies have brought supply roughly in line with local demand. CMHC’s recent reporting shows that federal programs (Housing Accelerator Fund, co‑op development, repair and rental financing) have helped create, repair, or support more than 500,000 homes since 2017, with nearly 300,000 of those targeted at markets with acute rental shortages—including many smaller and non‑metro communities. Canadian contacts tell me the new “Build Canada Homes” is an interesting move, promising to increase housing supply including scaling up factory homes.
A frequently cited rural success is Fernie, British Columbia (population around 5,000),in the Rocky Mountains just north of Montana’s Flathead Valley. The community faced workforce shortages because staff could not afford local housing. In 2022, Fernie launched a modular and tiny‑home project adding about 35 units with provincial support; this cut local housing waitlists by roughly 40% while fitting local character and climate, indicating that new supply was closely aligned with local workforce demand rather than speculative second‑home demand.
Other small Canadian towns (e.g., Nelson, BC) have used co‑operative housing to keep a stock of permanently affordable units that match local incomes. These co‑ops, often supported by CMHC programs, provide stable housing for lower‑ and moderate‑income residents even as nearby market prices rise, which effectively means local demand in these income bands is being met through non‑market supply.
What these “successful” rural places have in common
Across US and Canadian examples, rural places that are actually meeting or nearly meeting housing demand tend to share three traits:
Deliberate local strategy:
They treat housing as central to economic development (e.g., workforce recruitment, entrepreneurship) rather than an afterthought. Local leaders actively pursue outside funding, update zoning, and coordinate with employers to define what types of units are needed and for whom.
Right product, right price:
They add units that fit local incomes and demographics—smaller homes, modular units, co‑ops, or rehabbed rentals—rather than only large single‑family houses. This alignment is what lets a town actually meet demand instead of just adding units that locals cannot afford.
Use of higher‑level programs:
They plug into federal or national programs (USDA in the US, CMHC and the National Housing Strategy in Canada) to finance new construction, co‑ops, and rehabilitation at a scale that local tax bases alone could not support.
So the short answer is: yes, there are rural communities in the neighborhood who are more or less keeping pace with housing demand—but they’re mostly places with strong local organization and targeted use of federal/provincial tools, not “typical” rural markets where shortages and mismatches are still the norm.
Comprehensive Planning Case Studies
Burwell, Nebraska
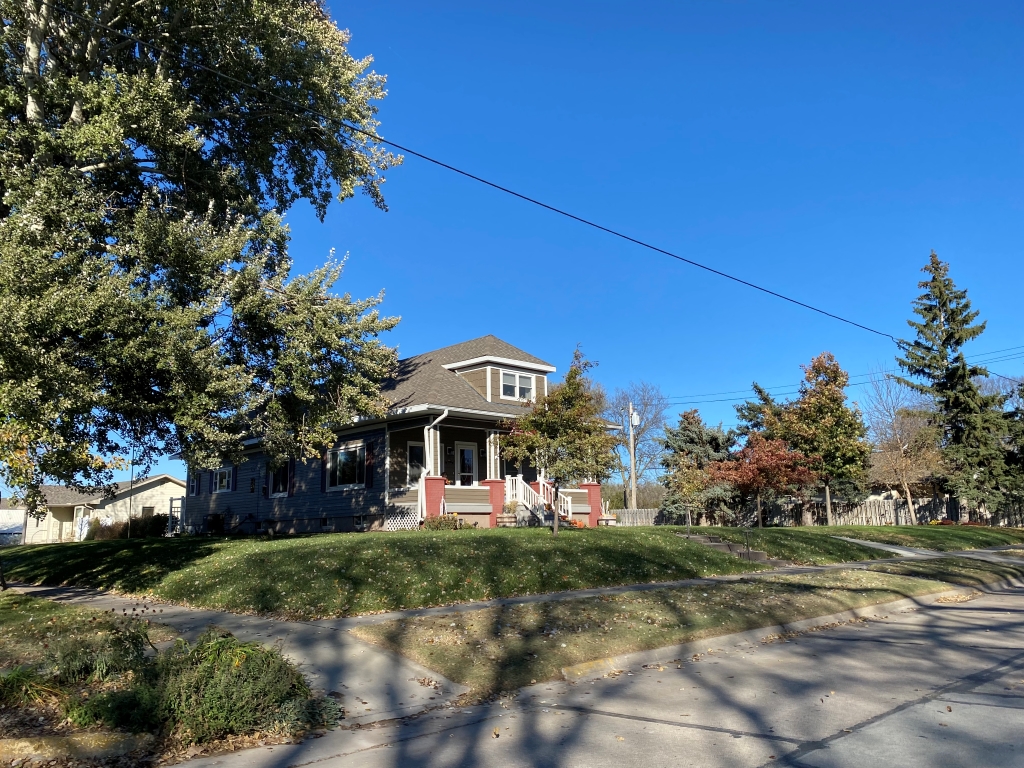
As I noted last week in our post about demographics, Marvin Planning Consultants (MPC) worked with the small city of Burwell, Nebraska (population 1,210), on their comprehensive plan update, Zoning Regulations review, Strategic Plan, and first-ever Capital Improvements Plan (CIP), with partners at MSA Professional Services and a free-lance consultant. In 2024, the City adopted the plans and in 2025, the process was recognized with awards from the Nebraska Chapter of the American Planning Association (APA) and the APA Small Town & Rural Planning Division (STaR).
We addressed housing in the fourth chapter of the City of Burwell, Nebraska, Comprehensive Plan, after the introduction, community engagement, and population/demographics. Chapter Four: Housing starts off with a general discussion of housing trends, again with caveats about the suitability of Census data in small towns—the best we have, be careful with margins of error. We mostly relied again on the American Community Survey (ACS) five-year series, in this case 2018-2022 (the latest numbers for 2020-2024 were just released the end of January 2025).
Marvin Planning Consultants
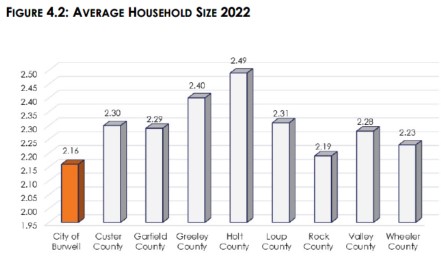
We looked at household statistics such as:
- Households over time, age, and makeup
- Average household size in the city and area counties
- Persons by household type (i.e. 1-person, 2-person, etc.)
- Huseholder age by household type (owner vs. renter)
Marvin Planning Consultants
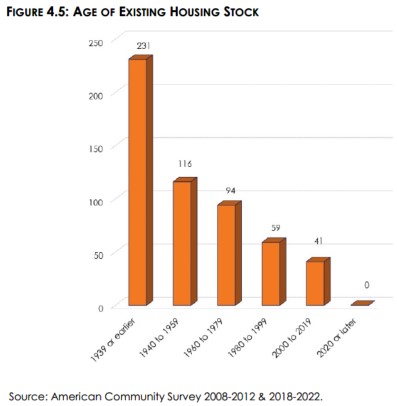
We also looked at statistics on housing units:
- Age of existing housing stock (hink, a lot of pre-WWII housing still in use)
- Units per structure
- Occupied vs. vacant housing units
- Vacancy rates by type (owner vs rent)
- Median Value of owner-occupied housing over time
- Median gross rent over time
- Number of housing units considered “substandard”
There are a lot of different metrics to measure housing supply, housing conditions, and housing affordablity. Full-scale housing plans will go into much more detail than we can get into in a general community-wide comprehensive plan.
Aztec, New Mexico
At my last firm, Consensus Planning, I was fortunate to return to work with a community where I had lived several years ago in the Four Corners region where Colorado and New Mexico meet Utah and Arizona. We worked with the City of Aztec (population 6,567 at the time) during the pandemic to complete a new comprehensive plan, which the City adopted in 2021. Our consulting team was led by Jacqueline Fishman, AICP, a principal with Consensus Planning.
Jackie structures comprehensive plans differently, but effectively. A strong executive summary introduces the plan, followed by a community profile with demographics and then a chapter on land use. Further chapters highlight functional elements of the plan, such as economic development and housing.
Chapter Five: Housing and Neighborhoods of the Comprehensive Plan 2040 of the City of Aztec, New Mexico, starts with the housing profile, relying mostly on ACS data (2014-2018 was the most recent available at the time).
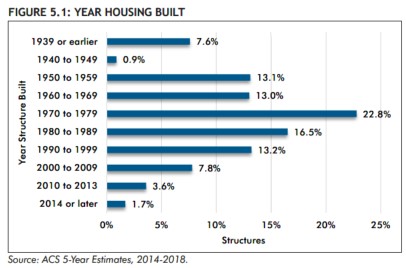
Cited statistics included such things as:
- Household characteristics
- Housing occupancy
- Year housing built
- Housing types (1-unit, 2-9 units, etc)
- Property values reported
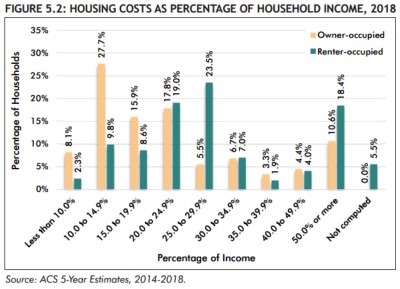
The analysis for Aztec delved deeper into concerns for housing affordability. This included statistics such as:
- Monthly housing costs
- Cost-burdened households (owner vs renter)
We also completed a more detailed windshield survey of housing conditions by neighborhood, as well as an analysis of housing needs of special populations (elderly, persons with disabilities, veterans, people experiencing homelessness, etc.).
These are just two examples of housing analysis in comprehensive plans for small towns in different regions of the United States.
Conclusion
Rural housing trends today are a map of deeper structural change. Where population is growing and incomes are rising, the problem is not “too few houses” in the abstract, but too few homes that local workers and retirees can realistically afford. Where there are fewer people, the surplus isn’t just vacant units; it’s under‑maintained, poorly located stock that no longer fits smaller households or modern expectations. The numbers in this post point to the same uncomfortable truth: we can’t fix rural housing with one national template.
For planners, local officials, and anyone who cares about small towns, the opportunity is to get very specific—about place, about people, and about product. That means workforce housing in amenity counties, rehab and right‑sizing in parts of the Midwest and Appalachia, and better tools for aging in place almost everywhere. Rural America’s housing future will be built county by county. The sooner we align supply with the actual lives people are trying to live, the better chance we have to keep these places vibrant for the next generation.
Next week we will discuss more about housing availability and affordability. I’m sure we’ll talk about Strong Towns’ ideas on housing and housing types like “Missing Middle housing” (one of my favorite housing ideas, scalable to any size community).

Read More
Books
Escaping the Housing Trap: The Strong Towns Response to the Housing Crisis by Charles L. Marohn, Jr. and Daniel Herriges (Wiley, 2024)
Arbitrary Lines: How Zoning Broke the American City and How to Fix It by M. Nolan Gray (Island Press, 2022)
Missing Middle Housing: Thinking Big and Building Small to Respond to Today’s Housing Crisis by Daniel Parolek (Island Press, 2020)
Broken Cities: Inside the Global Housing Crisis by Deborah Potts (Zed Books, 2020)
Rural Housing and Economic Development (Routledge Advances in Regional Economics, Science and Policy) by Don Albrecht et al ed. (Routledge, 2017)
Studies and Reports
“Housing Affordability and Housing Demand” by Louie, Mondragon, Najjar, and Wieland, FRBSF Economic Letter 2026-03, 2 February 2026
“America’s Housing Supply Problem: The Closing of the Suburban Frontier?” by Edward L. Glaeser & Joseph Gyourko, NBER Working Paper, May 2025
“Baby Booms and Asset Booms: Demographic Change and the Housing Market” by Marc Francke and Matthijs Korevaar, The Journal of Finance, Vol 80, Issue 5, 2025
“What is the impact of demographic shifts on housing demand?” by Daniel Ares, reAlpha blog, 18 September 2025.
“Homes on the Range: A Series on Housing Demand, Underproduction, and a Call for Action to Meet Housing Needs in the West to 2030” by Arthur C. Nelson, Ph.D., FAICP, The Western Planner, 2022.
Resources
OECD Housing website: https://www.oecd.org/en/topics/policy-issues/housing.html
USDA Rural Development—Rural Housing Service: https://www.rd.usda.gov/about-rd/agencies/rural-housing-service
USDA Economic Research Service (ERS)—Rural Economy & Population: https://www.ers.usda.gov/topics/rural-economy-population
US HUD Exchange—Rural Gateway: https://www.hudexchange.info/programs/rural/
Housing Assistance Council (HAC) Research and Information: https://ruralhome.org/information-center/rural-research-guides
Rural Community Assistance Corporation (RCAC) Housing Resources: https://www.rcac.org/housing
More from JCShepard.com
2026: Bring Your Plans to Life – Monthly Themes Preview
- Reviving Rural America: Why Heritage Tourism Is a Game-Changer Now (September 2025)
- How Small Towns Succeed: A Proven Playbook for Rural Action (November 2025)
- The Rural Comeback: How Small Town Innovation Sparks Growth (August 2025)
- How Small Towns Can Build a Strong Outdoor Economy Without Selling Out (June 2025)
Check out The 12 Planning & Sustainability Books You Need in 2026 and browse through the Small Town & Rural Community guides on our Resources page.
(As an Amazon Associate, we may earn commissions from qualifying purchases. Check your local library or bookshop, too.)
.